TorontoRealtyBlog
You’ve heard this one from me many times before, but I am convinced that over the last decade, there have been no two greater topics of discussion in Toronto than the Toronto Maple Leafs and the Toronto real estate market.
These two things have a lot in common, however.
They’re both infuriating. They’re both depressing. They’re both fun to cheer for at times and fun to cheer against later on.
They’re both exceptionally over-priced and they both underachieve relative to expectations.
And what I’ve noticed more so lately is that they both initiate conversations relative to the past, present, and future.
Many people like to look at the Toronto Maple Leafs’ past rather fondly, especially as it compares to the present. But consider this: while the Toronto Maple Leafs have won thirteen Stanley Cups, they won all thirteen of those championships when there were only six teams in the league. There are thirty-two now.
Perhaps we have a way of glorifying the past without thinking about how it looks through a present-value lens?
When it comes to the Toronto real estate market, we could probably divide people into three groups: those who are interested in where the market is, those who want to know where it’s going, and those who are completely obsessed with the past.
The latter group is having a tough time out there right now.
As I have written previously, and as I will share in a blog post this week or next, far too many sellers are looking at where prices were without thinking about where prices are.
Then again, every buyer out there is focused on where prices are going rather than where prices are, relative to where they were.
Do you follow?
A buyer in today’s market should be primarily concerned with where prices are, and be looking at where prices are going as a second take. To look at where prices were doesn’t have all that much value, unless the buyer is looking to feel good about his or her purchase, or, if the buyer wants to use the past to predict the future.
The media, to their credit, seem to be primarily reporting on where the market is, rather than where it was. I’m surprised I’m not seeing more articles about how much prices have declined in this area, or that area, since this date, or that date.
That has to do with prices, however. When it comes to sales, the media have definitely run with the statistics on new home sales, notably that they’re down 90% from the ten-year average.
New home sales in 2024 were the lowest since 1996.
That’s a sexy headline. I’m not surprised to have seen that many times.
Speaking of “not being surprised,” I am also not surprised that the media isn’t doing any reporting on price expectations, or more specifically, making any predictions on where the market is going. Maybe there’s just no value-add there? Maybe the real estate headlines are already catchy enough?
My favorite saying has always been, “You can make numbers say anything you want.
So here’s something:
The average GTA home price, as of May, 2025, is down by 16.0% since the peak in February of 2022.
The average 416 home price, as of May, 20215, is down by 4.6% since the peak in February of 2022.
What does that have to do with last month’s TRREB stats?
Nothing, really. Just making a point before we begin…
The GTA average home price increased by 1.2%, month-over-month, from $1,107,463 in April to $1,120879 in May.
For those who felt that the market was in freefall, or at the very least, in decline, the statistics would disagree.
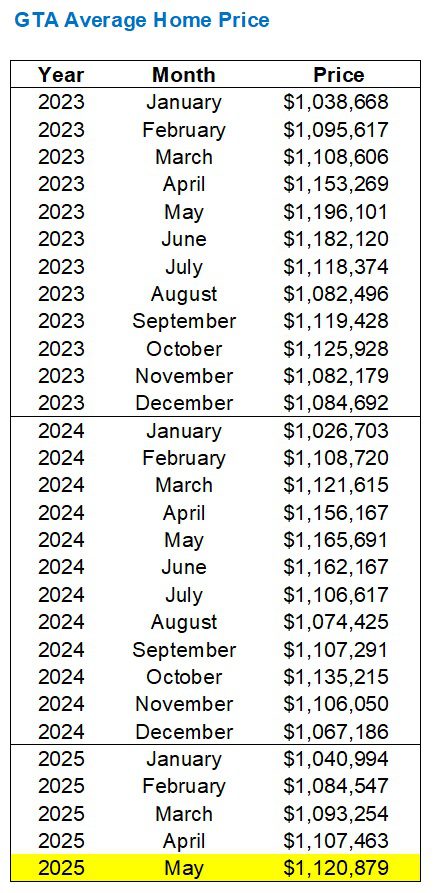
Here’s a refresher from 2023 to current:
Our high-water mark remains May of 2023 when the average home price was just shy of $1.2 Million at $1,196,101.
Of course, we came into 2024 asking, “Will we top $1.2 Million this year?”
We did not. But the average home price did peak in May of 2024, as it did in 2023, albeit at a mere $1,165,691.
Then along came May of 2025.
We’re down about 4% on a year-over-year basis, which lines up with the data from April as well.
Since that 2023 “peak,” we’re off about 6%.
Given the disparity between sales and inventory, you could argue that it’s shocking we’re not off by 40%, as you would expect to see in another industry for a different product.
That 1.2% month-over-month increase is also in line with historical trends for the period April-to-May:
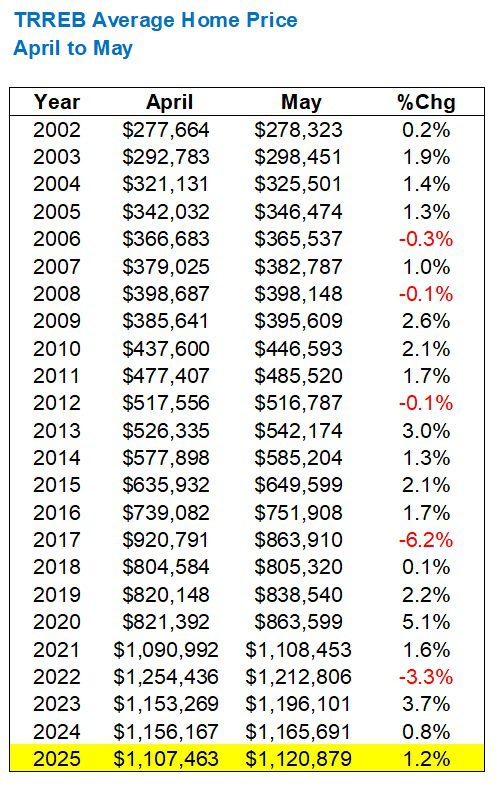
We all remember the pronounced market dips in 2017 and 2022, so it’s not surprising to see those figures in red. But the only other red figures are declines of 0.3%, 0.1%, and 0.1%, so it’s as though a price increase from April to May is automatic.
The big question, however, is will we peak in May?
If history is any indication, we’ve hit the spring peak…
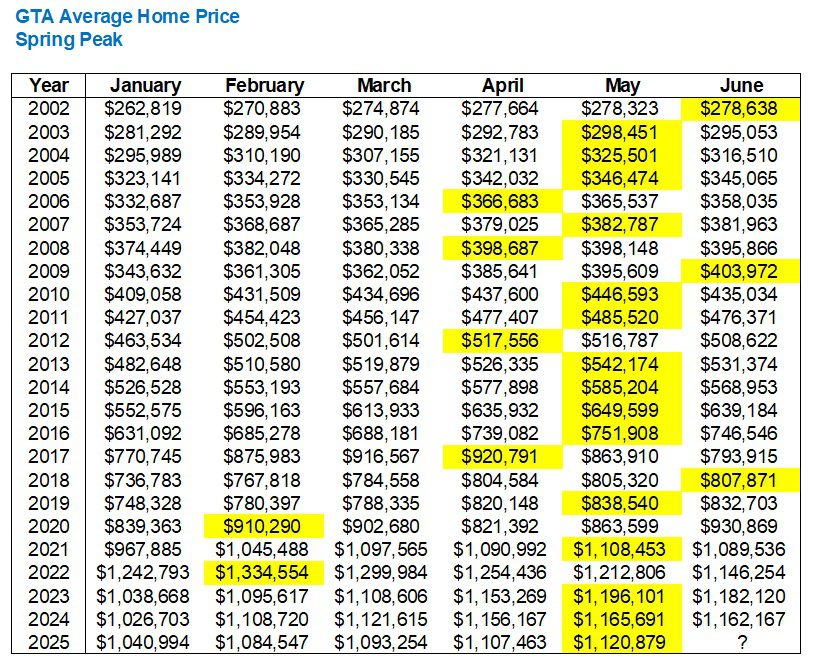
I could provide you with any number of reasons why the spring market in 2025 will be different, but if you’re simply playing the odds, history tells us that there’s a 62.5% chance that May will represent the spring pricing peak.
It’s anybody’s guess as to whether the average home price will be higher in June than it was in May, but I believe, no matter what happens, it’s a function of sales.
Sales, or a lack thereof.
Don’t get me wrong, there’s a lot for sale right now! But fewer buyers are pulling the trigger, and while I think that many folks who continue to sit on the sidelines will regret this in 18 months, that’s a whole other can of worms.
For now, sales are continuing to represent record lows:
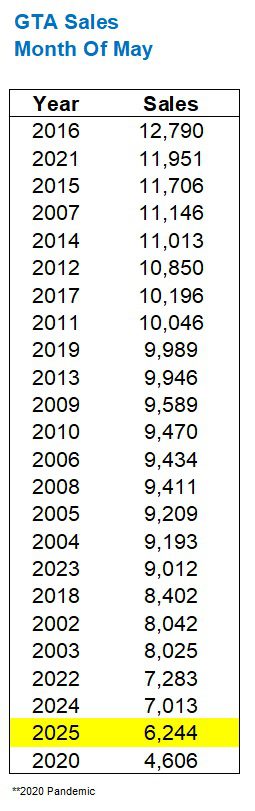
Ignoring May of 2020, which was affected by the pandemic, last month’s sales are the lowest in any month of may, all time.
This follows the trend from March and April which also saw the fewest sales of all time in those respective months.
But its not like the number of sales are declining, at least on a relative basis.
Sales were up 11.5% on a month-over-month basis, and that’s not a given in the period April-to-May. In fact, sales have decreased from April to May in three of the last four years:
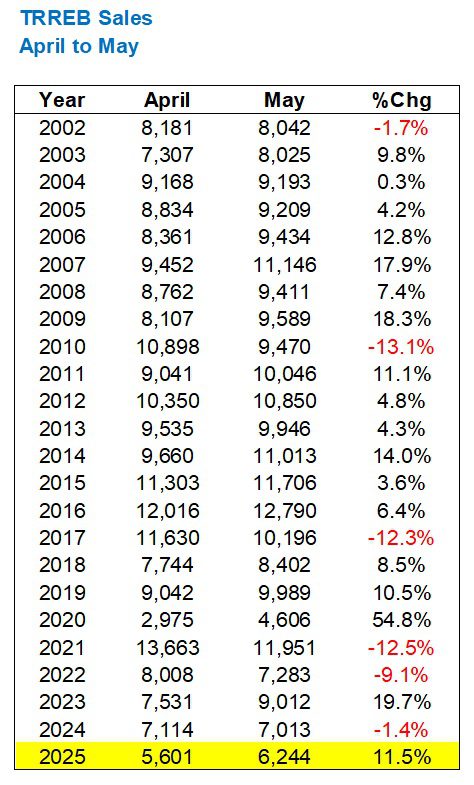
Yes, we saw the lowest sales of all time in May, but it’s simply a continuation of an existing trend and doesn’t reflect a market that is increasingly declining.
As for new listings, the following comes as no surprise:
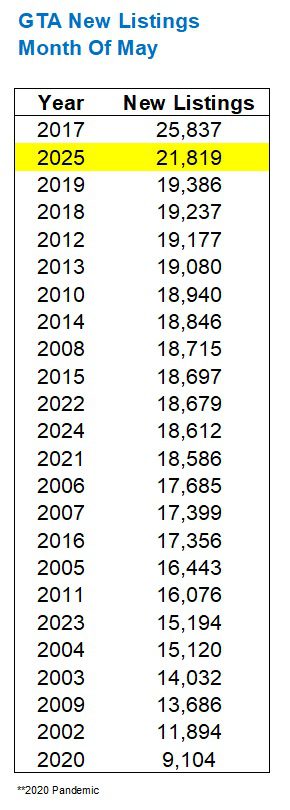
The only surprise might be the fact that a whopping 21,819 new listings are not the all-time record for the month of May.
Many of us remember the market in the spring of 2017 which saw a decline in prices and activity, paired with an increase in listings, that made 2022 look like a walk in the park.
All told, we saw the fewest sales in May and the second-most new listings in May, which is going to provide for an all-time low absorption rate, or sales-to-new-listings ratio.
Think back to 2016 when the ratio was a whopping 73.7% in May.
That pales in comparison to what we saw last month…
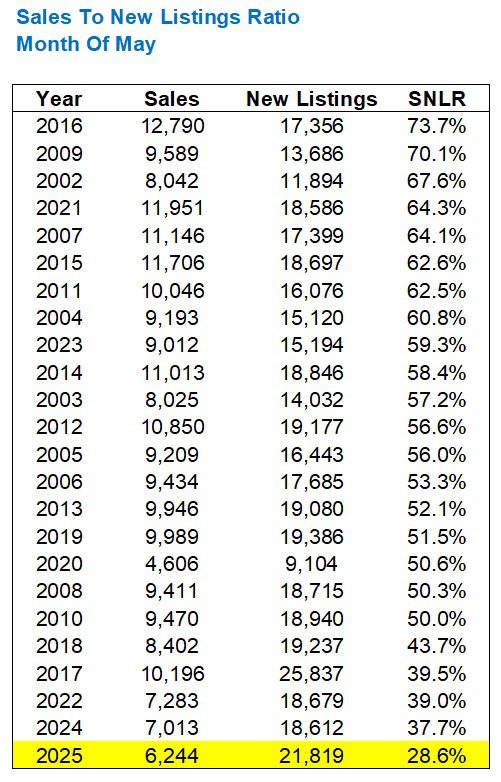
The 28.6% figure is eye-catching.
But the fact that it’s 9.1% lower than the next-lowest on the list (which happens to be 2024) is all the more fascinating.
For those playing along at home, this means we’ve hit a new 2025-low for the absorption rate, with that 28.6% figure just coming in below March’s 29.0%:
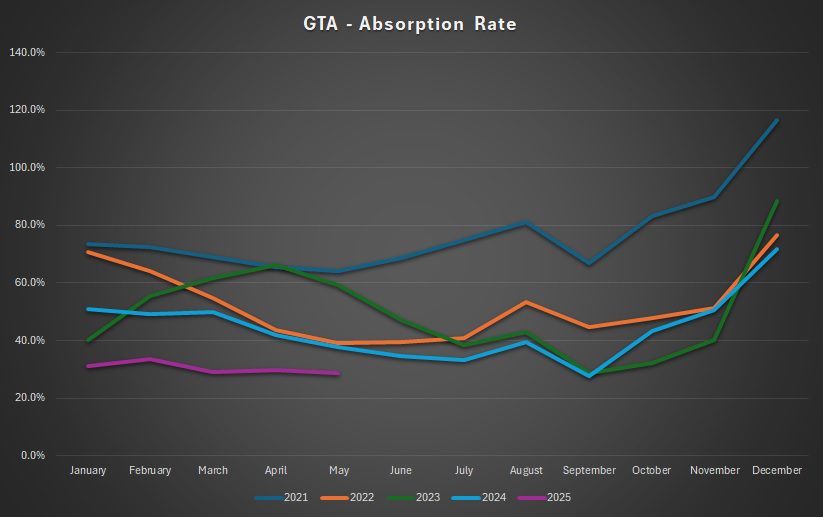
As the previous years show us, the SNLR does decline in the period April-May-June, but how much lowe could it go in June?
For the record, the lowest monthly SNLR on the chart above was 27.6% in September of 2024.
There’s one statistic that I’d like to talk about today, which I don’t usually talk about.
Active listings.
All these statistics are related, and since we look at sales and new listings, as well as the absorption rate, we don’t really need to consider “active listings” on a regular basis. Active listings is an exact tally of what is available on the last day of every month, essentially a measure of the previous month’s holdovers, plus new listings, minus sales.
As I said: all these statistics are related, and just as “months of inventory” or MOI is the inverse of the “sales-to-new-listings” ratio or SNLR, we also know that active listings will increase as the SNLR gets lower.
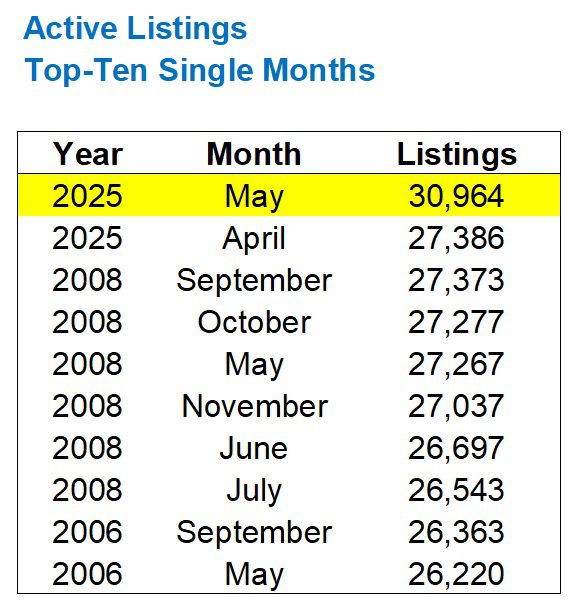
But coming off a month when the SNLR was only 28.6%, it seems to reason that active listings were going be high.
How high?
Well, as Redman & Methodman once said, “So high that I could kiss the sky…”
There were 30,694 active listings at the end of May, 2025.
That is the most ever recorded in a single month:
That’s a lot.
The second-most of all-time was in April, and we saw a 13.1% increase, month-over-month.
Assuming that sales will not outpace new listings in June, then active listings will increase. Again.
Another 13.1% increase would put this figure at a whopping 35,020.
Then again, many sellers could simply terminate their listings before summer begins, so we don’t really need to rely on sales to cover new listings. But either way, this is a figure to watch as we move forward!
Before we depart, I’ll leave you with this:
A colleague of mine suggested that the only reason why the GTA average home price wasn’t lower is because the condominium market is so weak, condo sales are scarce, and thus the average home price is being “propped up” by the fact that there are proportionally fewer condo sales than usual.
Agree?
Disagree?
Anybody want to do the research here?
Otherwise, I’ll put this in the queue for next Monday…
The post May TRREB Stats: Past, Present, Or Future? appeared first on Toronto Realty Blog.