TorontoRealtyBlog
For the seven-thousand-nine-hundred-forty-first time, I offer you the following:
“You can make numbers say anything you want.”
It’s something I’ve said here on TRB over and over, enough times that you might actually be tired of an introduction to today’s post that you swear you’ve read before at least once.
The saying or adage basically offers the concept of “perspective.”
Perhaps your glass is half full.
Perhaps my glass is half empty.
But when we look at the Toronto real estate statistics from the month of July, not only can we choose to look at the numbers from various perspectives, but it seems everybody else can too – and will!
On Wednesday, a colleague texted me the following:
“The Greater Toronto Area (GTA) experienced the best home sales result for the month of July since 2021.”
Question: Why am I paying hundreds of dollars per year for a marketing board that delivers sound bite size misinformation at a level that is borderline negligent, sandbagging me in front of my clients, instead of delivering real valuable insightful statistics based in reality?
Ouch!
Tell me how you really feel, bro. Don’t hold back!
This text is referring to a press release from our organized real estate body who led with something exceptionally positive, whether that’s because of a perspective that’s positive or a mandate to be positive.
To play devil’s advocate for a moment, it’s possible that the marketing or public relations department responsible for this release know nothing about statistics, market trends, or even real estate, and simply know about public relations.
Then again, “You can make numbers say anything you want,” so perhaps this is simply one entity’s perspective.
In any event, the media picked up on this very quickly, as they always do.
This popped up in my news feed:
“Toronto’s Housing Market May Be Shifting Again; Did You Finally Buy Or Sell?”
CTV News
August 6th, 2025
This is clickbait and nothing more.
Notice they won’t even take a side, as they tell us the market “could be shifting” but then instead of asking “Did you finally buy?” since so many people are on the sidelines, they offer, “Or sell,” just to ensure they don’t alienate or deter anybody.
Classic media nonsense.
The article opens:
Toronto’s housing market just had its busiest July in four years, a new report suggests — but what does that mean for those individuals who were once left on the sidelines?
New figures from the Toronto Regional Real Estate Board show 6,100 homes changed hands last month, up nearly 11 per cent compared to July 2024.
Busiest July in four years eh?
SOUND THE ALARM!
Can you hear Marv from the original Wall Street?
“Phew! This baby’s goin’ to Pluto, man!”
Or, maybe, just maybe, July is a nothing-month, with very little significance in the overall context of the market, and an 11% year-over-year increase in sales is meaningless.
Throughout Wednesday and Thursday combined, there will likely be 15-20 news stories on the Toronto real estate market, none of which will actually analyze the market statistics. Most articles just parrot press releases offered by real estate boards, economists, or the major banks.
See what you want.
Believe what you want.
Now having said that, let me offer you my analysis, which I think – grading on a curve, is actually as unbiased as you’ll get…
Starting with the overall GTA home price:
The GTA average home price is down 4.5%, month-over-month, and 5.0%, year-over-year.
This is seasonality, of course.
A house isn’t “worth” 4.5% less today than it was 35 days ago, but these statistics are worth considering and analyzing when put up against prior years and market cycles.
Case in point, I would ask any onlooker, enthusiast, or PR spin doctor:
“Is a 4.5% decline significant? Why or why not?”
To answer that, we’d have to look at every other June-to-July price change to compare last month’s 4.5% drop:

The month-over-month decline of 4.5% is lower than the same period in any of 2022, 2023, or 2024.
This would be a bullish indicator, if anything.
But if you want to compare to a twenty-year data set, it’s worth noting that the average decline from 2002 to 2024 was 3.8%.
Pick your poison.
Pick your perspective.
Last month, we noted that the year-over-year decline of 5.2% was much higher than any of January through June.
This trend reversed, at least somewhat last month…
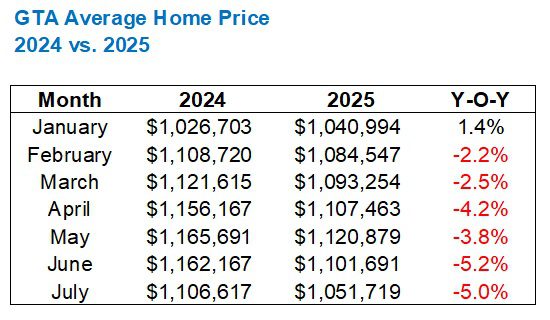
Perhaps a better perspective on the year-over-year data on a monthly basis is expressed as follows:
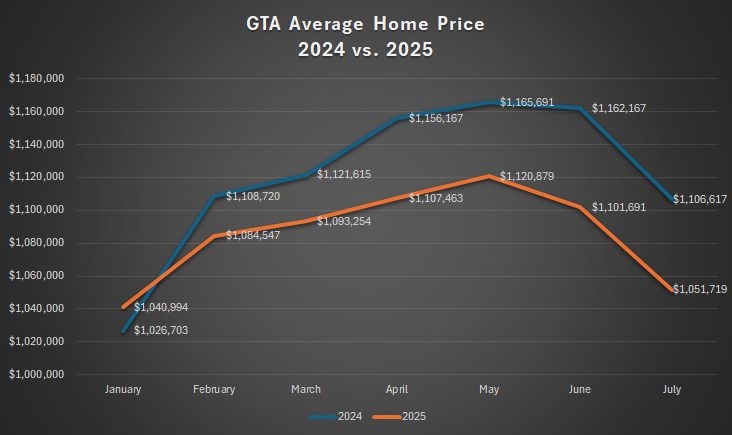
I don’t know about you, but this tells me, “Prices are lower in 2025 than in 2024, but the market is moving exactly as it was last year.”
Save for January, of course.
But the trendlines from February through July are like Francine Pascal’s Wakefield Sisters…
Let’s get to the sales data, since this is what the media led with.
We’ve essentially seen the lowest sales of all time so far this year.
February, March, April, and May each showed the lowest sales this millennium, and June showed the second-fewest.
But as several media outlets reported, sales in July were up by 11% from 2024.
So where does that put us?
Here:

Sixth-fewest.
Now, I don’t want to pump TRREB’s marketing team’s tires here, but this is a reversal of trend.
That might not be a lot of sales in a 2002 – 2024 context, but in a 2022 – 2024 context, it is.
I would conclude, very simply, “July sales were strong.”
If you need more evidence of a possible trend reversal, here’s a look at what sales typically do from June to July:

July sales only declined by 2.3% from June.
Compare that to the preceding years and you’ll see it’s a pittance, even taking 2021 into consideration, which was a bull year!
So is this the start of a new trend?
Can we expect August through December to show year-over-year increases?
I don’t know.
Nobody does.
But this could throw a wrench in my whole, “We’re on pace for record-low sales” jibber-jabber…
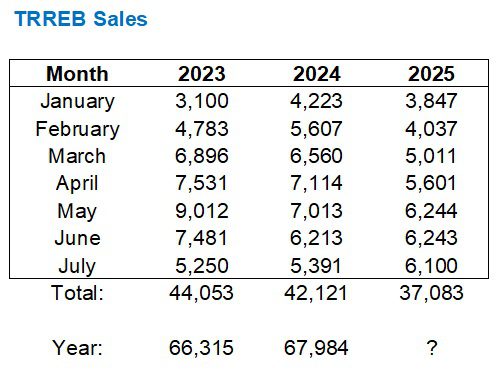
As we know, 2023 and 2024 produced the fewest sales in any year this millennium.
2025 is on pace to obliterate the record-low from 2023.
At last estimate, I was thinking around 58,000 sales.
So either July is an outlier, or it’s going to pull the year 2025 up from the basement and put it back in line with 2023 and 2024.
As for new listings, we saw the second-most of all time:
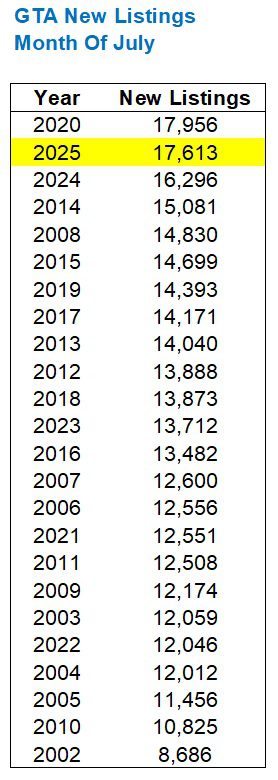
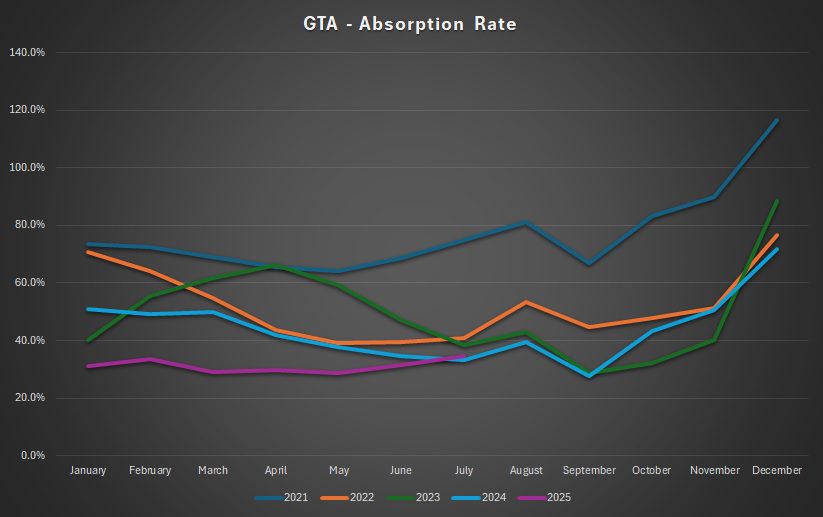
But with the increase in sales, I would expect the absorption rate to maybe, just maybe, not be at all-time-low levels…
….maybe?
Let’s take a look:

Ah, second-lowest!
There’s a win for the market bulls!
In fairness, the absorption rate in July was completely in line with 2022, 223, and 2024, as seen here:
Now what about active listings?
Remember when I sounded the alarm in April because we saw a record-high with 27,386?
Then remember when we saw over 30,000 for the first time in May?
Well, active listings declined on a month-over-month basis, but we’re still over 30,000:

This is the third month ever with 30,000+ active listings, but it’s also the third straight month!
Fascinating stuff.
Will we see this figure decline below 30,000 in August?
That really only matters to the gamblers out there, since 29,999 or even 26,000 is just way too many for a “balanced market.”
Last, but not least, I want to put the various TRREB regions into perspective.
We speak broadly of the GTA but within the GTA exists Halton, Peel, Toronto, York, and Durham.
Looking specifically at the absorption rate or the “SNLR,” we can see how some regions fall deeper into a “buyer’s market” than others:

I’m shocked to see Durham Region at the top of this list, but I believe the fewest condos exist, on a relative basis, in Durham Region, so this might explain it.
Speaking of condos, the average GTA condo price of $709,905 in May went up to $731,232 in June, which made zero sense to me. Well, last month the figure came in at $684,257, which makes even less sense.
My statistical analysis of the condo market is quarterly, so the next installment will be in October.
Good lord, October?
But we’re still in prime August! We have time to soak it all in!
Slow down, summer!
Keep pace with the rest of us…
The post July TRREB Stats: Slow Down, Summer! appeared first on Toronto Realty Blog.